The Library in Figures 2019
In this section, we present a selection of indicators reflecting the activity of the IQS Library during the 2019 academic year. The figures are presented in a visual format to make them easy to consult and to provide a clear overview of the use of our services, collections, electronic resources, and more.
2019
IQS Scientific Production
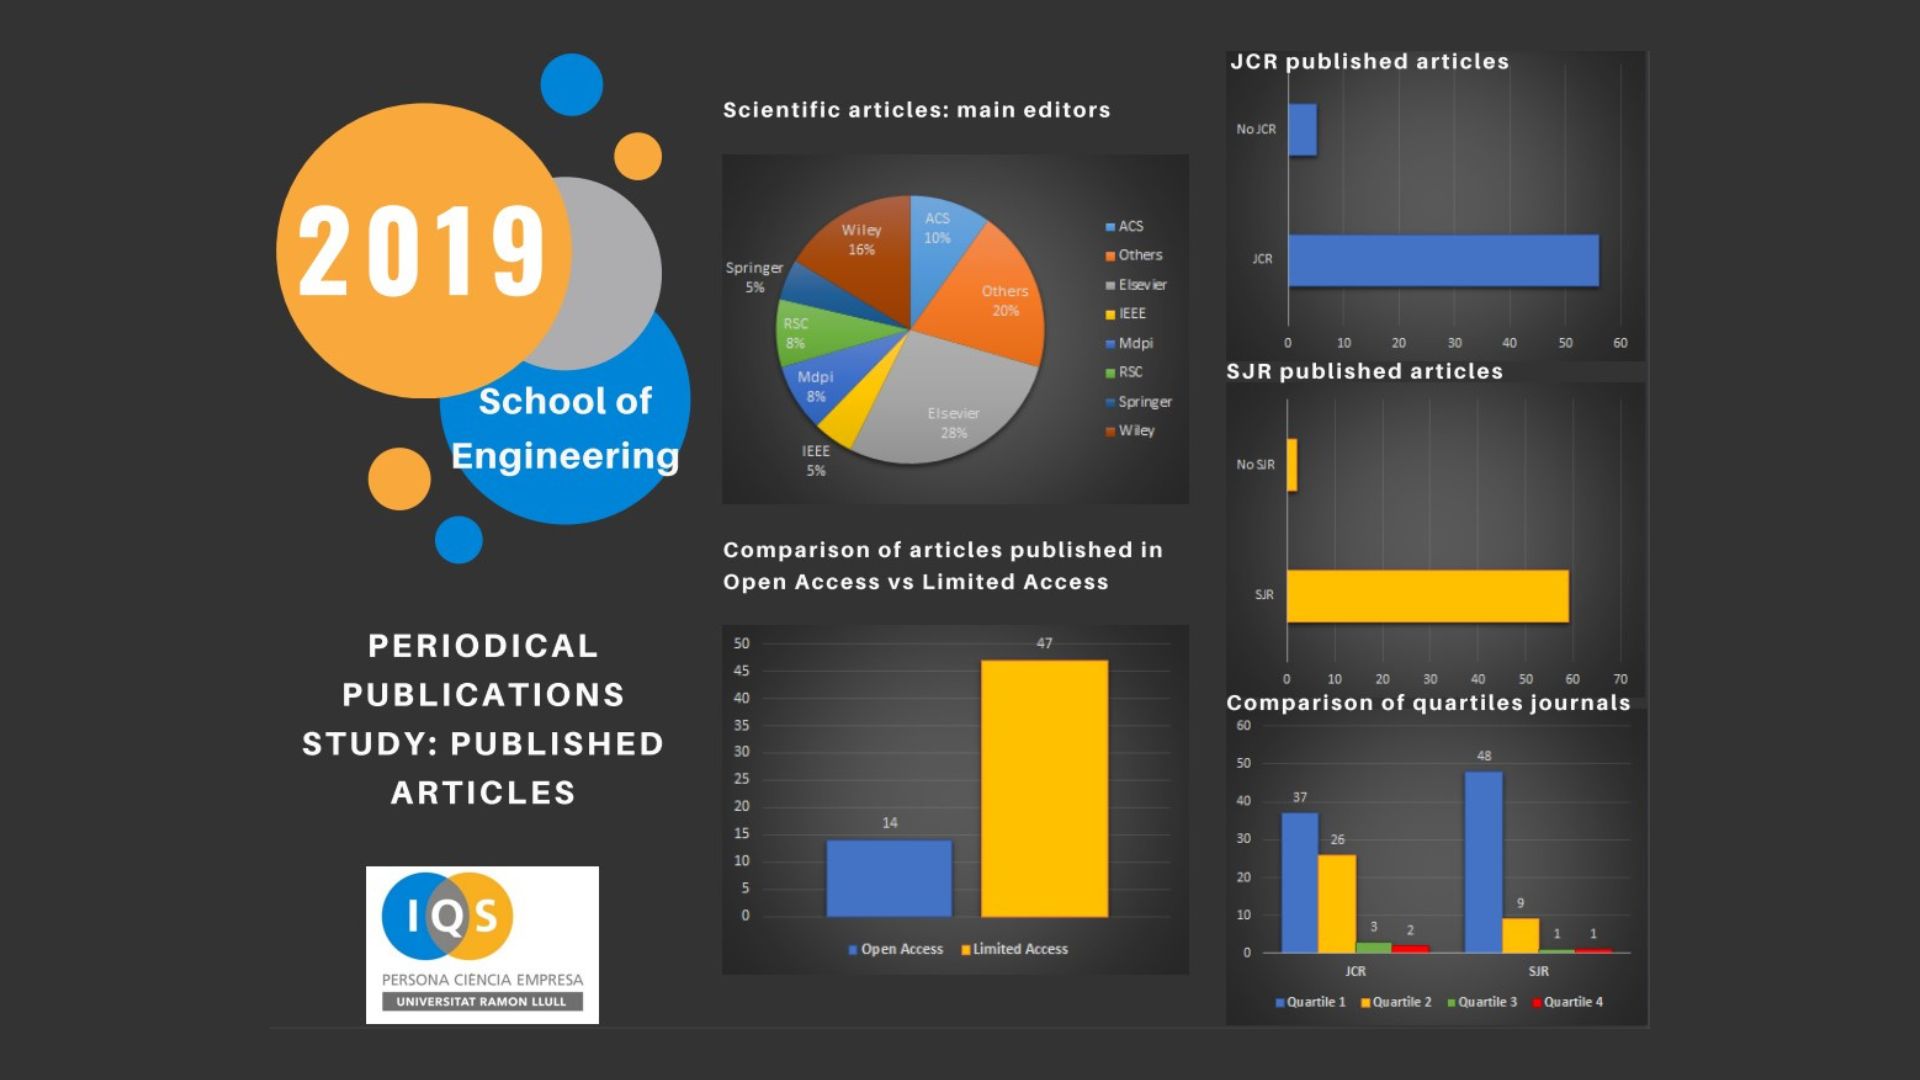
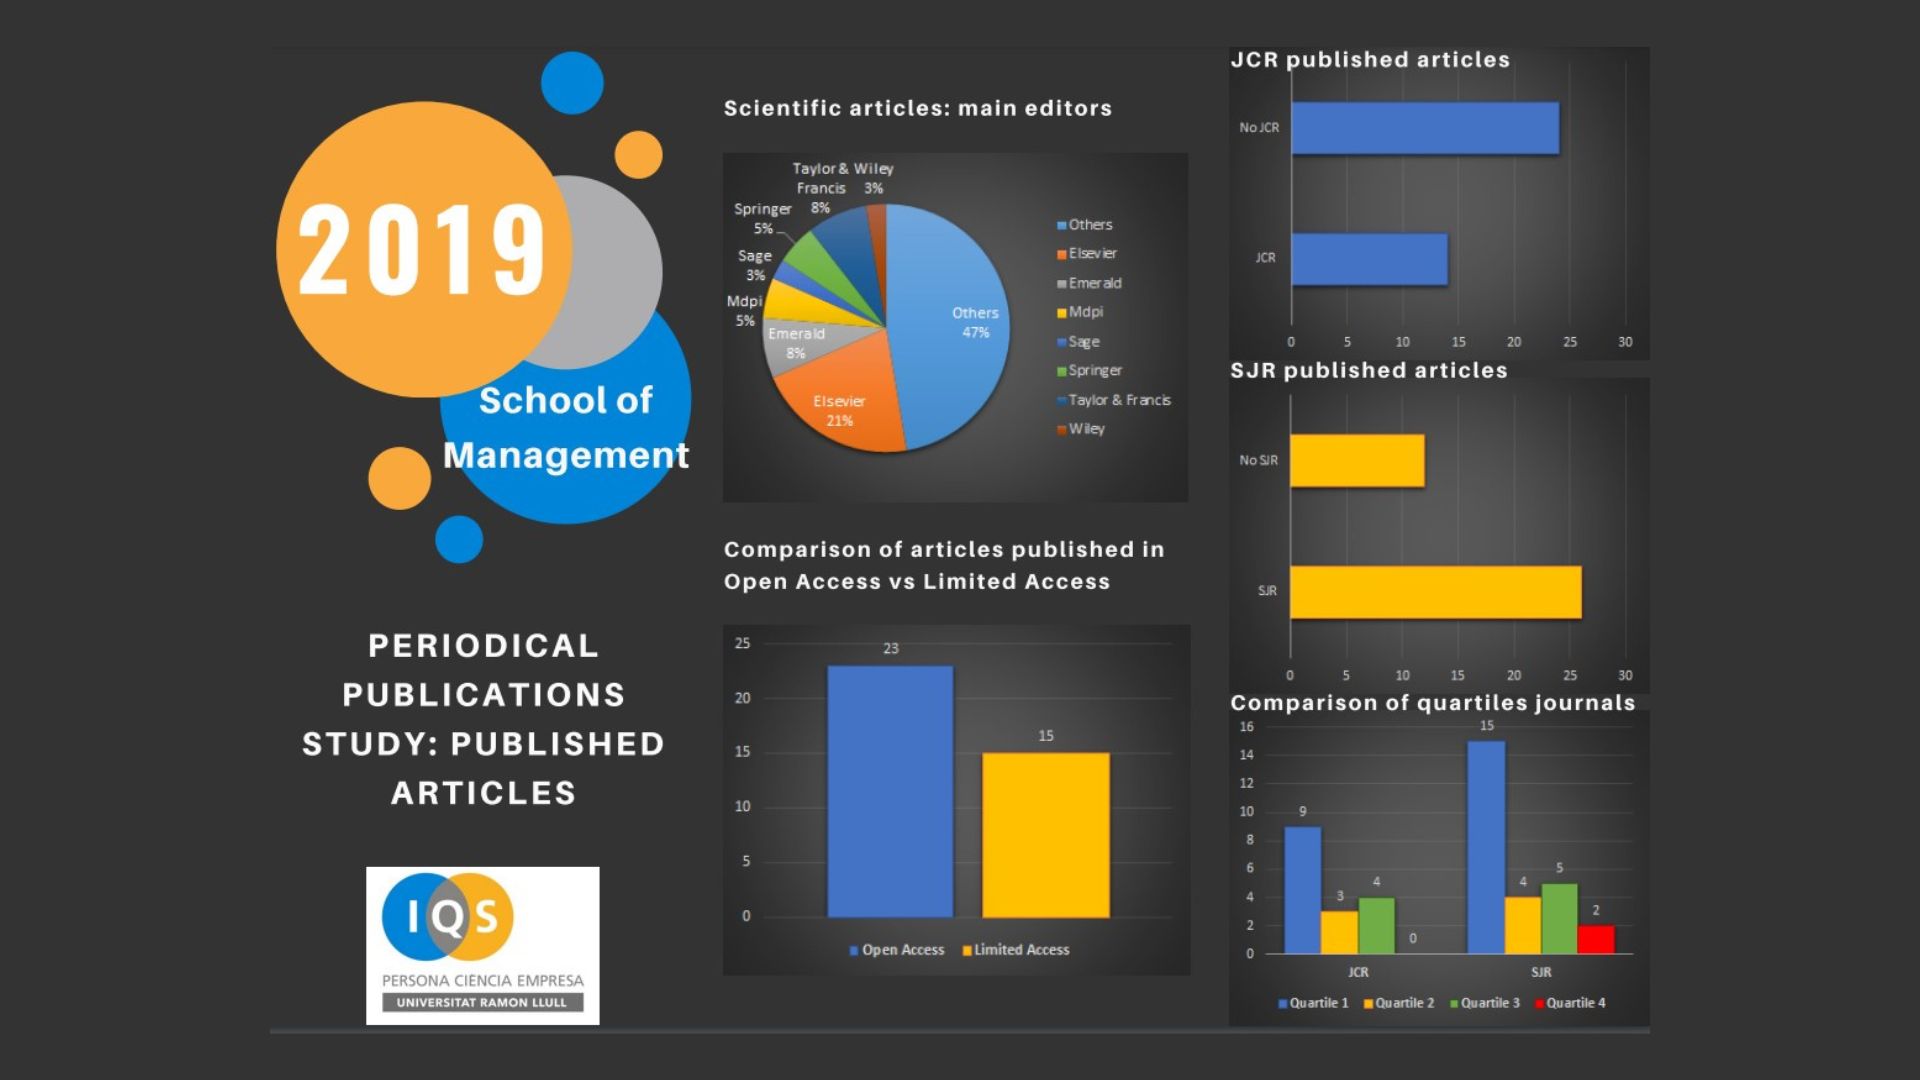
We present the graphic report of the 2019 scientific production for the School of Engineering and the School of Management.
The report details the total number of articles published by each School during 2019. This includes how many were published in open access, the main publishers, and the Quartile ranking of the journals indexed in JCR and CiteScore.
Yo can consult the full IQS scientific production for 2019 in MERIT.
Academic Years 2018-2019 and 2017-2018
The Library in Figures
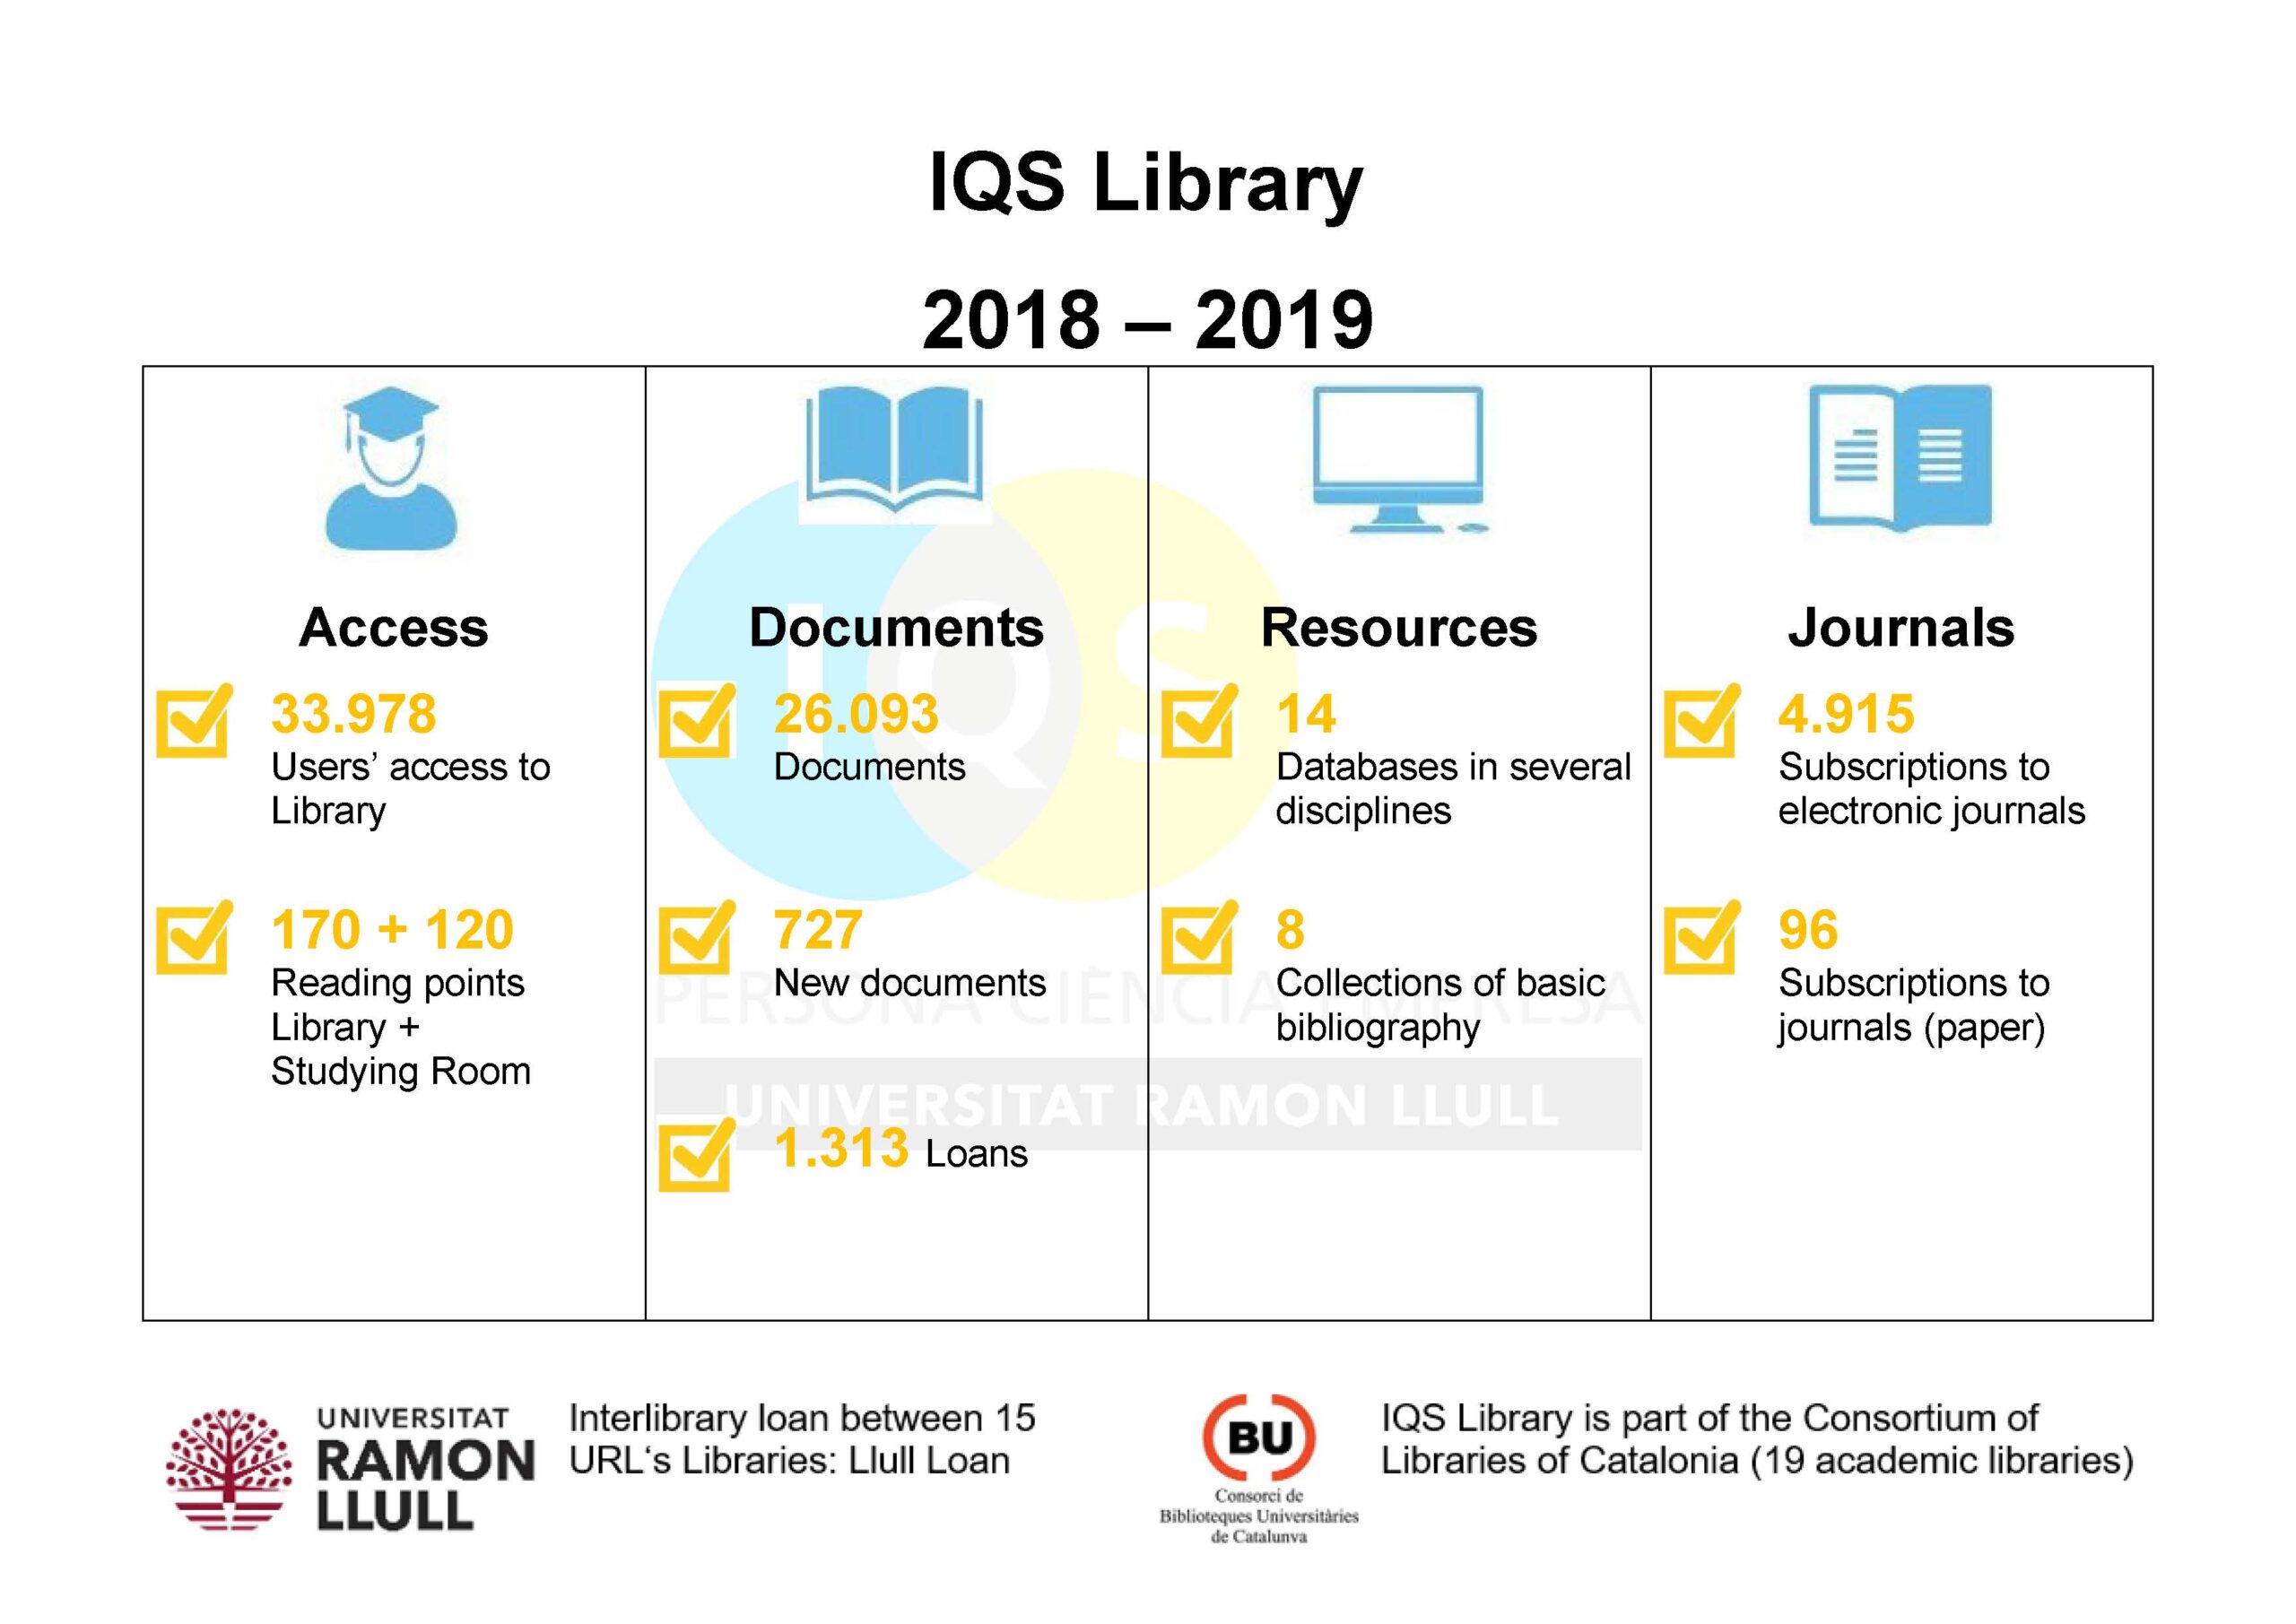
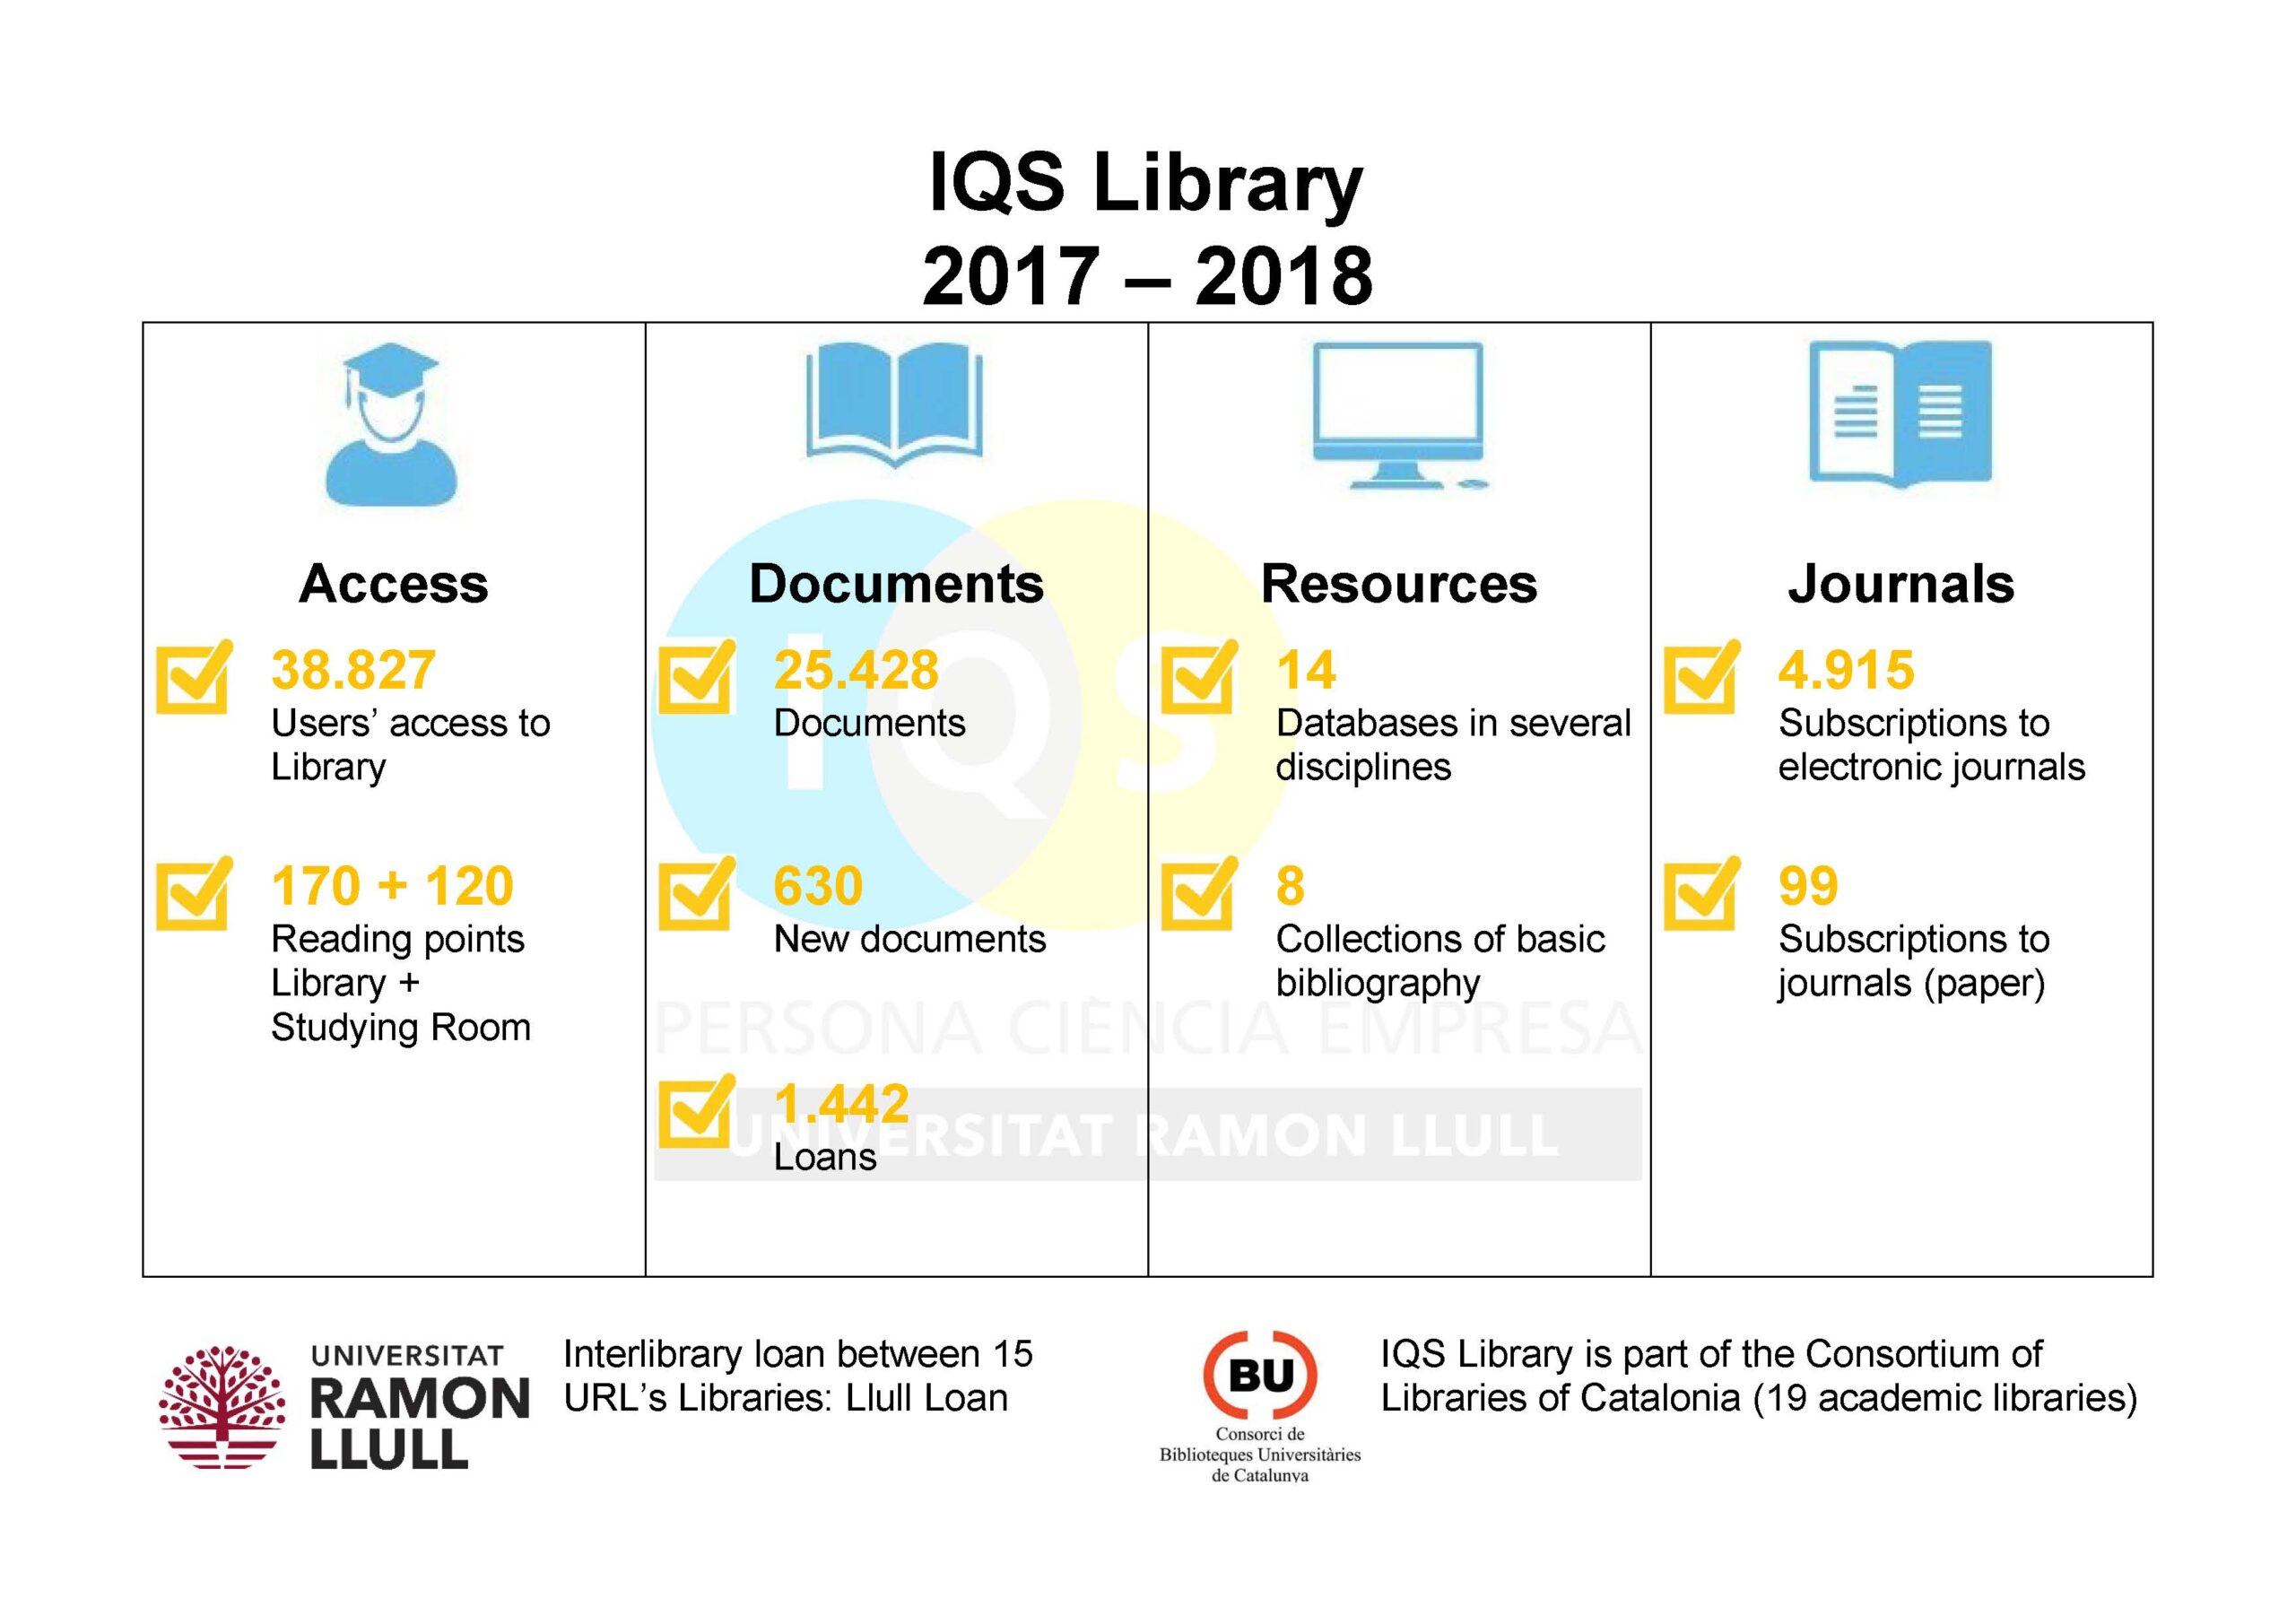
We present the accumulated figures for the 2018-2019 and 2017-2018 academic years across our main areas of activity:
- Use of library spaces
- Use of library services
- Teaching support
- Support for research and open science